LLM Report Automation Proof of Concept
Initial Goal
During reporting, there is a lot of repetitive analysis that gets done. Automating, or at least semi-automating these reports would save valuable time to be used on more valuable deliverables.
For this project, I wanted to:
- Automatically import the previous report
- Import relevant data
- Feed the data through an LLM to generate analysis, similar to previous reporting
- Automatically populate the deck with the relevant data and the analysis.
Implementation
Before we start with the code, we need to make our base presentation. The package I am using works best with PowerPoint file types (.pptx), so I recommend downloading a program that can open them. I personally went with LibreOffice as its free and fully capable.
However you decide to proceed, we need to make a deck. I am choosing to make the slide I am manipulating the second slide, so use that one if you want to plug and play the code.
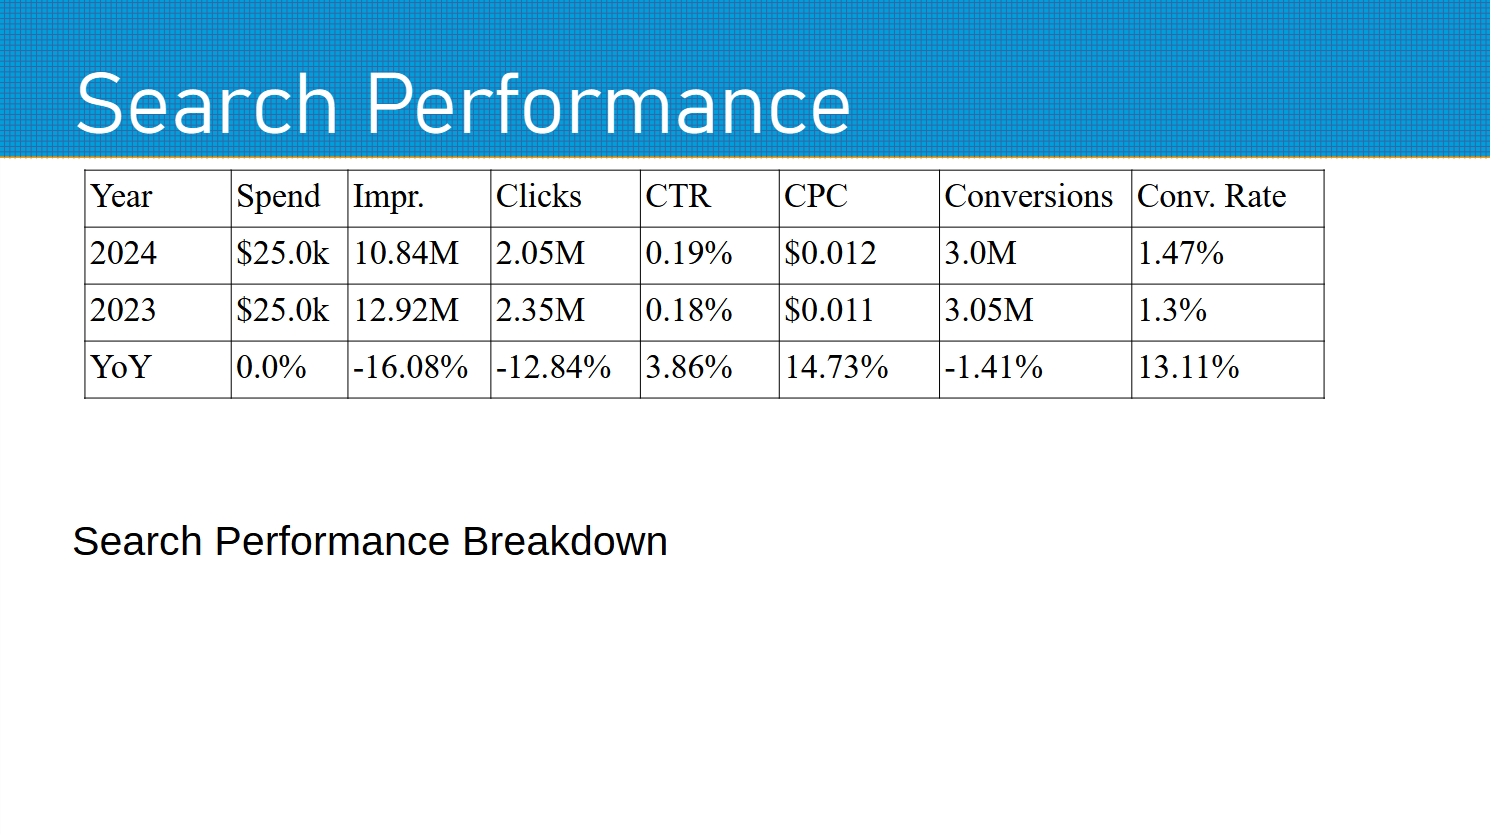
For this simple proof of concept, I am simply using a table and text box, so make sure to add those to this slide. It will help us later to pre-format it, as shown below, to make sure everything shows up as intended.

With that, lets start with the packages we are using:
from pptx import Presentation
#this is for importing, exporting, and manipulating the deck.
import pandas as pd
from gpt4all import GPT4All #this is an opensource wrapper for LLMs
I am using synthetic data for this analysis (so I can share it with you!). Ideally, in a real report, more data would be included, such as account change history; however, given that is outside the scope of this project, and expose confidential information, I am leaving those out.
For the data, I am storing spend, impressions, clicks, conversions, cpm, ctr, conv. rate, cpa, and cpc. For each year, there is a monthly and quarterly csv with the corresponding data with the first interval starting at index 0.
With all that out of the way, lets get started, for real this time.
#starting with time period selection variables for ease of repeated use
year_selection = 2024
quarter_selection = 1
prs = Presentation(f'{your_directory}')
slide1 = prs.slides[1] #assigned the second slide to a variable for future use.
#lets go ahead and import the relevant data as per the time selection
current_quarter = pd.read_csv(f'{year_selection}-quarterly.csv')
quarter_columns = current_quarter.columns
current_quarter = current_quarter.iloc[quarter_selection - 1]
current_month = pd.read_csv(f'{year_selection}-monthly.csv')
month_columns = current_month.columns
current_month = current_month.iloc[(1 * (quarter_selection - 1)):(3 * (quarter_selection - 1) + 1)]
current_month = current_month.reset_index(drop=True)
yoy_quarter = pd.read_csv(f'{year_selection - 1}-quarterly.csv')
yoy_quarter = yoy_quarter.iloc[quarter_selection - 1]
yoy_month = pd.read_csv(f'{year_selection - 1}-monthly.csv')
yoy_month = yoy_month.iloc[(1 * (quarter_selection - 1)):(3 * (quarter_selection))]
yoy_month.reset_index(inplace=True, drop=True)
if quarter_selection == 1:
qoq_quarter = pd.read_csv(f'{year_selection - 1}-quarterly.csv')
qoq_quarter = qoq_quarter.iloc[quarter_selection + 2]
else:
qoq_quarter = pd.read_csv(f'{year_selection}-quarterly.csv')
qoq_quarter = qoq_quarter.iloc[quarter_selection - 2]
qoq_month = pd.read_csv(f'{year_selection - 1}-monthly.csv')
qoq_month = qoq_month.iloc[((quarter_selection - 1) * 3):(3 * quarter_selection)]
qoq_month.reset_index(inplace=True, drop=True)
When making analysis for reports, volume and efficiency metrics are a great inclusion, however the change is a better choice to give an overview of the trajectory of the business. As such, this will generate them so they can be fed into the LLM.
Now that we have the data and data deltas imported, we can feed them into the LLM. Lets load up the model.
model = GPT4All("Meta-Llama-3-8B-Instruct.Q4_0.gguf", device='gpu') #this will initialize (and download, if
applicable) Llama 3
#these two lines are to help tune the model to generate a report:
#giving it an identity
#and what answer it should predict during training.
system_template = 'An analyst that generates key takeaways based on marketing data for the leadership
team\n'
prompt_template = 'USER: {0}\nREPORT:'
I use a chat in order to facilitate training the model in a multishot manner, and to enable customizable responses. One off queries are possible with the package, however the quality of responses are vastly inferior.
year = 2024
quarter = 1 #initalize variables for the training for loop
with model.chat_session(system_template, prompt_template):
while quarter != quarter_selection or year != year_selection:
#I import the corresponding data and deltas for the quarter here, leaving out to avoid repetition
response = model.generate(
prompt=f'Please write a short analysis (700 characters or less) for the {year}-Q{quarter} slideshow from
this table of deltas: {deltas_1}',
temp=5)
response = model.generate(
prompt=f'Here is the final version that got delivered to the client: {refined_text[f"{year}-Q{quarter}"]}.
Please make future reports like this.',
temp=0) #I made this inside a callable function, refined_text is the text from the deck after it has been
cleaned to its final version after generation
response = model.generate(
prompt=f'What would be the final version that gets delivered to the client, based on these: {deltas}',
temp=5) #note the different prompt, this tells the model to follow the template from the final versions
provided.
Now that we have the data, and the analysis from the LLM, we need to feed them back into the deck. Lets start with the table.
table = slide1.shapes[1] #.shapes returns a list of objects based on the objects in the slide. In this case,
the table is index 1.
table.table.cell(0, 1).text = 'Spend' #cells are accessed by (y, x) coordinates in this manner, and can have
text accessed and assigned in this way.
table.table.cell(1, 1).text = f"${number_round_stylized(current_quarter['spend'])}"
table.table.cell(2, 1).text = f"${number_round_stylized(yoy_quarter['spend'])}"
table.table.cell(3, 1).text = f"{deltas['yoy_quarter_delta'][0]['spend']}"
I'm leaving it at one column for brevity, but the process is the same for the whole table. Lets move on to the text box.
text = slide1.shapes[2] #this returns the text box object
refined_text[f'{year}-Q{quarter}'] = text.text #this allows for text to be accessed, this is how I made the
refined text for the training
text.text = analysis_generator(deltas, quarter_selection, year_selection, refined_text) #this is how the
analysis is fed back into the deck
prs.save(f'{year_selection}-Q{quarter_selection}.pptx') #save the deck now that the data and analysis has
been fed into it
So now that we have this setup, all we have to do is put it to use. We can generate analysis for the first quarter, adjust it to suit our needs, and then rerun it for the next quarter and so on.
Without prior training the LLM is much too wordy, exceeding its token cap and making it unreadable on a slide.
**Q1 2024 Key Takeaways**
The Q1 2024 marketing performance report highlights significant growth and shifts in our digital marketing
efforts.
**Quarter-over-Quarter (QoQ) Insights:**
• Spend increased by a whopping 47.08%, driving more resources into campaigns.
• Impressions surged by 14,141.07% as we expanded reach.
• Clicks skyrocketed by 76,292.88%, indicating strong engagement.
• Conversion Rate jumped by an impressive 471.22%.
• CPA and CPM saw significant drops (-99.67% and -90.46%, respectively), suggesting improved ROI.
**Year-over-Year (YoY) Insights:**
• Spend grew modestly by 0.92%, maintaining momentum from last year.
• Impressions increased slightly, up 4.75%.
• Clicks decreased by a relatively small margin (-6.45%).
• Conversion Rate rose by an encouraging 18.8%.
These findings
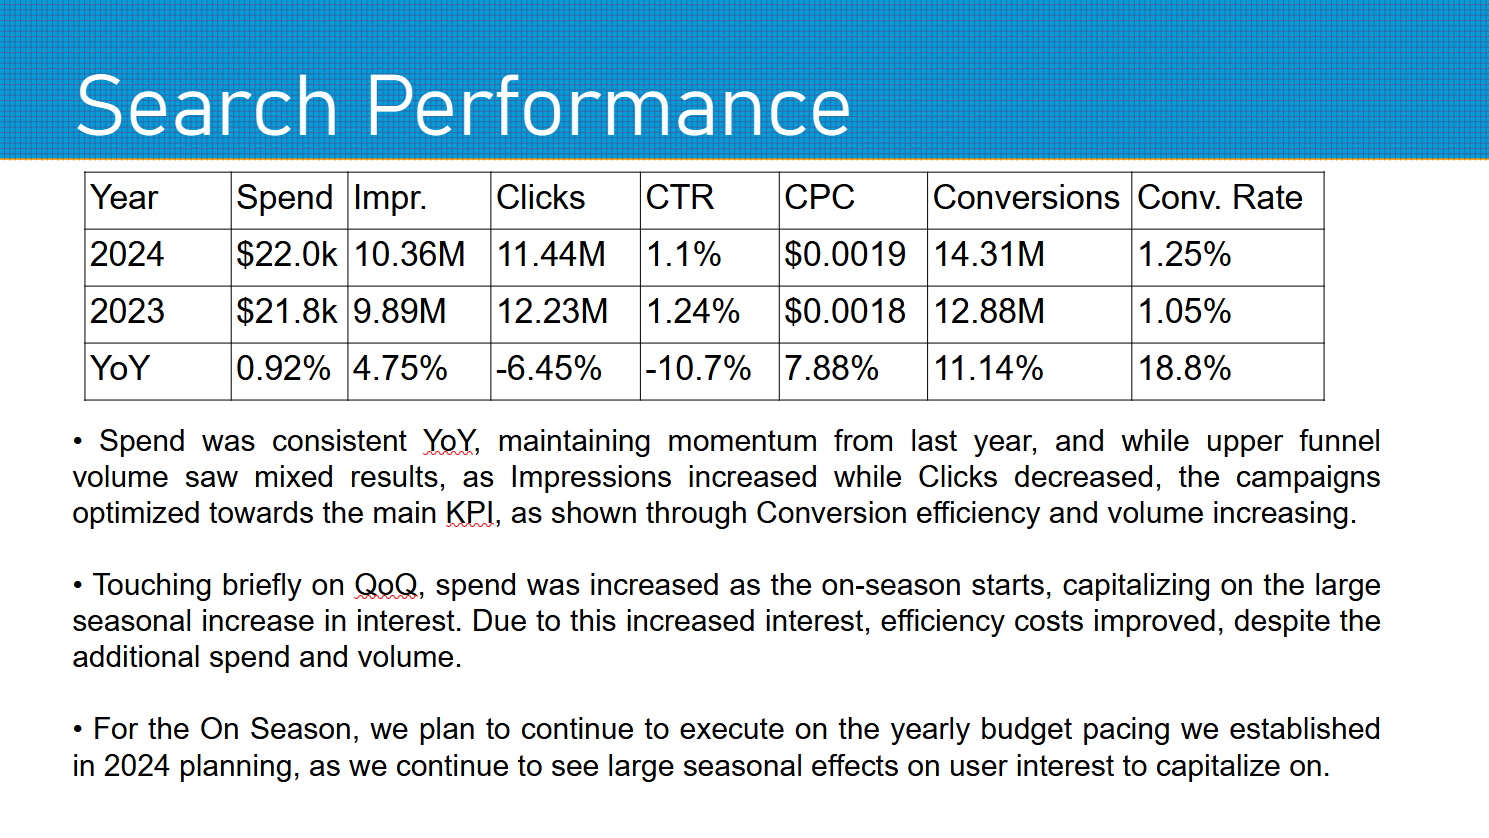
I refined that down to a more brief analysis that can fit in the test slide:

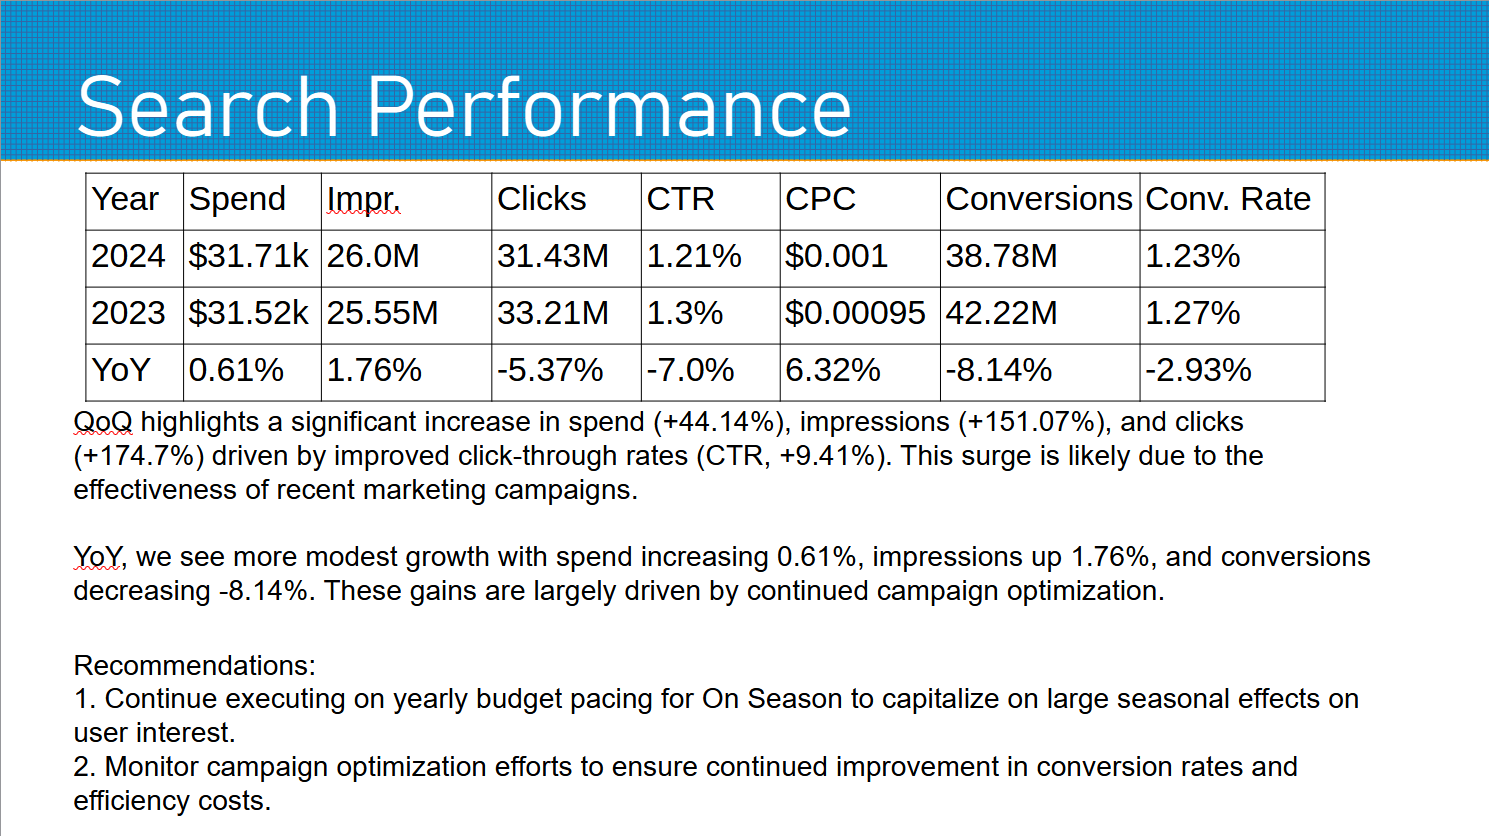
And here is the second output, trained on the refined output created for Q1:
* Quarter-over-Quarter (QoQ) highlights a significant increase in spend (+44.14%), impressions (+151.07%), and
clicks (+174.7%) driven by improved click-through rates (CTR, +9.41%). This surge is likely due to the
effectiveness of recent marketing campaigns.
* Year-over-Year (YoY), we see more modest growth with spend increasing 0.61%, impressions up 1.76%, and
conversions decreasing -8.14%. These gains are largely driven by continued campaign optimization.
Recommendations:
1. Continue executing on yearly budget pacing for On Season to capitalize on large seasonal effects on user
interest.
2. Monitor campaign optimization efforts to ensure continued improvement in conversion rates and efficiency
costs.
Overall, Q1 2024 shows promising growth, with room for further refinement and optimization. I look forward to
continuing this analysis
Please note that the final report is more concise and focused on
While this was too lengthy to be readable on a slide, in just one iteration, the quality has massively improved.
Its not exactly perfect-it refers to YoY gains, but doesn't address Conversion decreases-but it shows that
the LLM is learning and making analysis more fit for a slide.
THis time it only took a few tweaks, and it fits in the test slide:

Takeaways
So for this, the multi-shot approach proved successful. The LLM was successfully able to refine its responses
with further training.
With a different model (4o would obviously increase quality, though alongside cost) or further tuning, output
quality could be improved.
In addition, if used to generate a real report,
further data could be included, such as account change history, or planned changes to allow the LLM to integrate
highlights
with further training to increase the quality. As previously mentioned,
I didn't include real data as to be able to share it openly here.
In order for this to save the most time, automated data retrival will be required, be that in the form of an API
connection,
web scraping, or something else. Once that is in place, reports will eventually become quickly proofreading and
correcting, reserving
the bulk of human effort for creating new aspects the report and adding valuable insights.
A moonshot goal could be to have the LLM act a personal assistant. If automated data retrival is achieved, and
an LLM
is trained to generate analysis and recommendations, A logical next step could be to integrate that trained
model into
recommending action steps on a more regular basis. This could have the advantage of collating human intelligence
of a team together, to create a tailored assistant with their cumulative knowledge.
One last note: automatic implementation of these recommendations from an LLM
should be avoided to prevent LLM erratic behavior and hallucinations from affecting accounts. Instead, more
traditional
programming methods should be used instead to ensure predictable and reliable behavior.

